WebLogic Servers View
These displays present performance metrics and alert statuses for all Oracle WebLogic Servers and Clusters. Clicking WebLogic Servers from the left menu opens the WebLogic Servers Table display, which shows all available utilization metrics for all Oracle® WebLogic servers in a tabular format. The following displays are available:
| • | Servers Heatmap: Opens the WebLogic Servers Heatmap display, which shows status and alerts for all Oracle® WebLogic servers in a heatmap. |
| • | Clusters Table: Opens the WebLogic Clusters Table display, which enables you to track utilization and performance metrics for all clusters on a particular domain, or on all domains. |
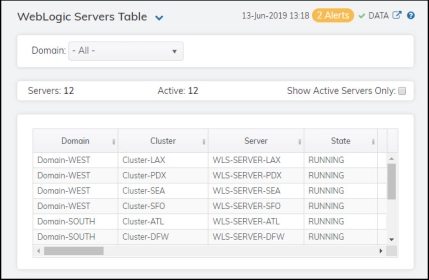
WebLogic Servers Table
This display provides utilization metrics for all WebLogic Servers for a particular domain in a tabular format. Each row in this table includes heap, processing, thread, and version metrics (among others) for a particular server. Click a column header to sort column data in numerical or alphabetical order. Double-click on a table row to drill-down to the WebLogic Server Summary display and view metrics for that particular server. You can click on the drop down list in the display title to toggle between commonly accessed displays.
|
Filter By |
|||
|
|
Domain |
Select the domain for which you want to view data, or select All Domains to view data for all domains. |
|
|
Fields and Data |
|||
|
|
Servers |
The total number of servers on the cluster. |
|
|
|
Active |
The total number of active servers on the cluster. |
|
|
|
Show Active Servers Only |
Select this check box to display only the active servers in the table. |
|
|
|
Table This table shows information for the selected domain/cluster(s) combination. Click on a table row to drill-down to the WebLogic Server Summary display and view metrics for that particular server. |
||
|
|
|
Domain |
The name of the domain. |
|
|
|
Cluster |
The name of the cluster. |
|
|
|
Server |
The name of the server. |
|
|
|
State |
The current state of the server. |
|
|
|
Alert Level |
The current alert level.
|
|
|
|
Port |
The port on which this server is listening for SSL connections.* |
|
|
|
JVM Proc Load % |
A snapshot of the load that the virtual machine is placing on all processors on the host computer.* |
|
|
|
Heap Free % |
The percentage of free heap memory on the server.* |
|
|
|
HeapSizeMax |
The maximum amount of heap, in bytes, available for use.* |
|
|
|
Used Heap |
The total amount of heap used, in bytes.* |
|
|
|
Current Heap |
The current size of the JVM heap, in bytes, being used.* |
|
|
|
Open Sockets |
The current number of sockets registered for socket muxing on this server.* |
|
|
|
Hogging Threads |
The number of hogging threads on the server.* |
|
|
|
Exec Threads Total |
The current number of execute threads.* |
|
|
|
Exec Idle Threads |
The current number of idle threads. |
|
|
|
Restarts |
The total number of restarts for this server since the cluster was last started.* |
|
|
|
All Proc Avg Load |
The average load percentage for all processors on the host computer.* |
|
|
|
Shutting Down |
When checked, denotes that the server is currently shutting down.* |
|
|
|
Restart Required |
When checked, denotes that the server needs to be restarted in order to activate configuration changes.* |
|
|
|
Uptime |
The length of time (in milliseconds) that the server has been up and running.* |
|
|
|
Startup Time |
The length of time (in milliseconds) that it took for the server to start up.* |
|
|
|
WebLogic Version |
The current version of WebLogic running on the server.* |
|
|
|
JVM Type |
The type of JVM currently being used on the server.* |
|
|
|
Java Version |
The current version of Java running on the server.* |
|
|
|
JavaVendor |
The name of the vendor of the Java version running on the server.* |
|
|
|
OS |
The name of the operating system running on the server.* |
|
|
|
Expired |
This check box becomes automatically checked when the data displayed in the row has exceeded the specified cache expiration time (set by default at 45 seconds) and is no longer current. Once the cache has been refreshed and is displaying current data, the check box will return to being unchecked. This check box will remain unchecked as long as the cache has been refreshed within the specified cache expiration time and the data is current. |
|
|
|
Time Stamp |
The date and time this row of data was last updated. |


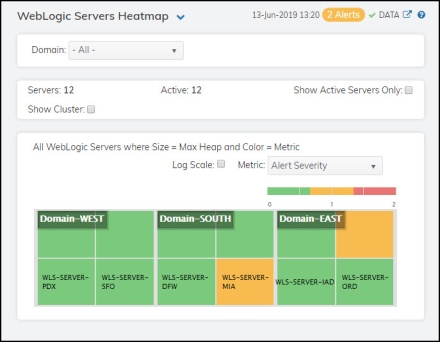
WebLogic Servers Heatmap
Clicking Servers Heatmap in the left/navigation menu opens the WebLogic Servers Heatmap display, which allows you to view the status and alerts of all Oracle® WebLogic servers. You can view the servers in the heatmap based on the following metrics: Alert Severity, Alert Count, Jvm CPU %, Host CPU %, Jvm Memory %, Open Sockets, Thread Total Count, and Hogging Threads.
The heatmap is organized by host, each rectangle representing a server. The rectangle color indicates the most critical alert state. Click on a node to drill-down to the WebLogic Server Applications Summary display and view metrics for a particular connection. You can toggle between the commonly accessed displays by clicking the display title’s drop down list. Mouse-over rectangles to view more details about host performance and status.
|
Filter By: |
|||
|
|
Domain |
Select the domain (or All Domains) from the drop down list for which you want to view data. |
|
|
Fields and Data |
|||
|
|
Servers |
The total number of active, inactive, and standby servers. |
|
|
|
Active |
The number of active servers listed in the display. |
|
|
|
Show Inactive Servers Only |
Select this check box to display onlyl the inactive servers in the heatmap. |
|
|
|
Show Cluster |
Select this check box to display the names of the clusters in the heatmap |
|
|
Heatmap |
|||
|
|
Log Scale |
This option enables visualization on a logarithmic scale, and should be used when the range in your data is very broad. For example, if you have data that ranges from the tens to the thousands, then data in the range of tens will be neglected visually if you do not check this option. This option makes data on both extreme ranges visible by using the logarithmic of the values rather than the actual values.
|
|
|
|
Metric |
Select the metric driving the heatmap display. The default is Alert Severity. Each Metric has a color gradient bar that maps values to colors. The heatmap organizes the instances by host, where each rectangle represents an instance. Mouse-over any rectangle to display the current values of the metrics for the instance. Click on a rectangle to drill-down to the associated WebLogic Server Applications Summary display for a detailed view of metrics for that particular domain. |
|
|
|
|
Alert Severity |
The maximum alert level in the item (index) associated with the rectangle. Values range from 0 to 2, as indicated in the color gradient bar 2 -- Metrics that have exceeded their specified ALARMLEVEL threshold and have an Alert Severity value of 2 are shown in red. For a given rectangle, this indicates that one or more metrics have exceeded their alarm threshold. 1 -- Metrics that have exceeded their specified WARNINGLEVEL threshold and have an Alert Severity value of 1 are shown in yellow. For a given rectangle, this indicates that one or more metrics have exceeded their warning threshold. 0 -- Metrics that have not exceeded either specified threshold have an Alert Severity value of 0 and are shown in green. For a given rectangle, this indicates that no metrics have exceeded a specified alert threshold. |
|
|
|
The total number of alarm and warning alerts in a given item (index) associated with the rectangle. The color gradient bar |
|
|
|
|
Jvm CPU % |
The percentage of JVM CPU currently being used in a given item (index) associated with the rectangle. The color gradient bar |
|
|
|
Host CPU % |
The percentage of Host CPU currently being used in a given item (index) associated with the rectangle. The color gradient bar |
|
|
|
JVM Memory % |
The percentage of JVM Memory currently being used in a given item (index) associated with the rectangle. The color gradient bar |
|
|
|
Open Sockets |
The total number of open sockets currently being used in a given item (index) associated with the rectangle. The color gradient bar |
|
|
|
Thread Total Count |
The total number of threads in a given item (index) associated with the rectangle. The color gradient bar |
|
|
|
Hogging Threads |
The total number of hogging threads currently being used in a given item (index) associated with the rectangle. The color gradient bar |
 , where
  shows the range of the value/color mapping. The numerical values in the gradient bar range from
  shows the range of the value/color mapping. The numerical values in the gradient bar range from
  shows the range of the value/color mapping. The numerical values in the gradient bar range from
  shows the range of the value/color mapping. The numerical values in the gradient bar range from
  shows the range of the value/color mapping. The numerical values in the gradient bar range from
  shows the range of the value/color mapping. The numerical values in the gradient bar range from
  shows the range of the value/color mapping. The numerical values in the gradient bar range from
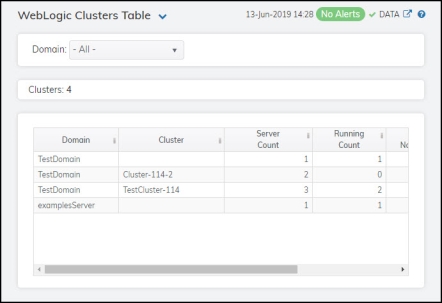
WebLogic Clusters Table
Clicking Clusters Table in the left/navigation menu opens the WebLogic Clusters Table display, which allows you to track utilization and performance metrics for all clusters on a particular domain, or on all domains. Each row in this table includes metrics for a particular cluster. Click a column header to sort column data in numerical or alphabetical order. Double-click on a table row to drill-down to the WebLogic Servers Table display and view metrics for that particular server. You can click on the drop down list in the display title to toggle between commonly accessed displays.
Note: Fields with an asterisk (*) at the end of the field definition contain data that is provided by the WebLogic Server MBean interface. Refer to WebLogic documentation for more information regarding these fields.
|
Filter By |
|||
|
|
Domain |
Select the domain containing the clusters for which you want to view data, or select All Domains to view data for clusters in all domains. |
|
|
Clusters |
The current number of clusters listed in the table. |
||
|
|
Table Lists the clusters in the currently selected domain, or lists all clusters in all domains. |
||
|
|
|
Domain |
The name of the domain |
|
|
|
Cluster |
The name of the cluster.* |
|
|
|
Server Count |
The total number of servers on the cluster.* |
|
|
|
Running Count |
The total number of servers running on the cluster.* |
|
|
|
Percent Not Running |
The percentage of servers not running on the cluster.* |
|
|
|
Time Stamp |
The date and time this row of data was last updated. |